
Let’s be honest. Currently, most businesses around the world are data-rich. But they are also insight-poor.
You have sales figures from your regional offices. Also, you have customer logs from your web portal. On top of that, you have inventory lists sitting in your SQL servers. But what are you actually doing with it?
If you are like 90% of the managers I talk to, then you run your business looking in the rear-view mirror. Basically, you build dashboards that show what happened last month.
However, that is useless.
The reason is that the market moves too fast. For example, one wrong guess on inventory during the holiday season and you lose massive revenue. So, you don’t need to know what happened yesterday. Instead, you need to know what will happen tomorrow.
This is where Predictive Analytics in Power BI comes in.
First, forget the idea that you need a PhD in statistics. Second, you don’t need a team of expensive data scientists either. In fact, if you know how to click a mouse, you can use Microsoft Power BI service to build models. Resultingly, these models predict the future.Here is exactly how to do it. First, we will look at the native tools. Next, we will check the machine learning with power bi capabilities. Finally, we will see how to use Python if you want to get technical.
What Actually Is Predictive Analytics?
Simply put, predictive analytics is just a fancy way of saying “Look at the past to guess the future.”
Specifically, it uses historical data and statistical algorithms.1 Plus, it uses machine learning techniques. The goal is to identify the likelihood of future outcomes.

For a business analyst, it answers the questions that keep your boss awake at night.
- “Will we hit the sales target next quarter?”
- “Which machines in the factory are likely to fail?”
- “Which high-value customers are about to leave us?”
Because of analytics in power bi, this power is now available to everyone. So, you don’t need complex code. You just need clean data.
Method 1: The “One-Click” Forecast (Time Series)
Believe it or not, you don’t always need complex machine learning in power bi to look smart. Actually, for 80% of business cases, the built-in tools work fine.
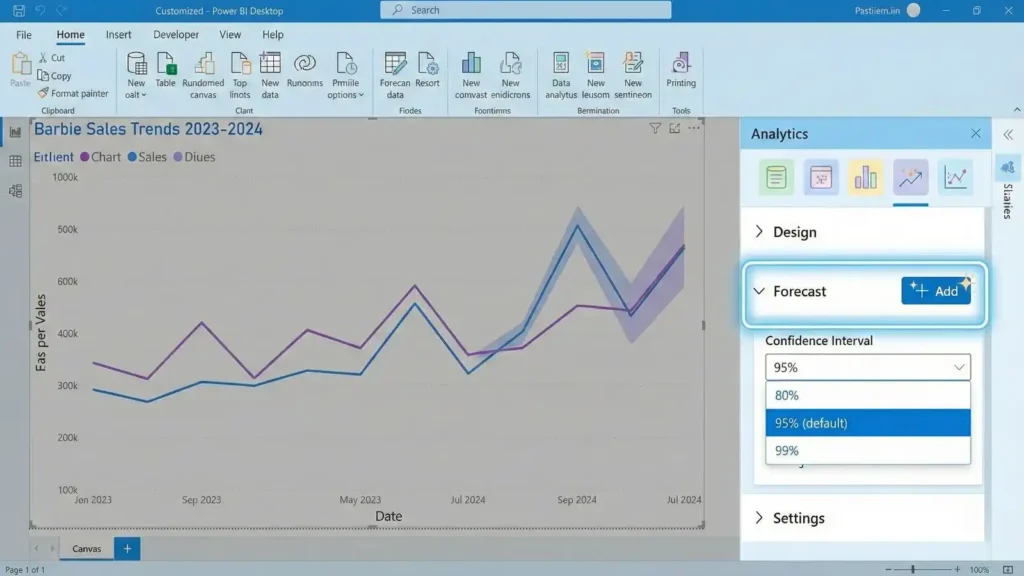
Here is how is forecasting done in power bi without writing a single line of code.
- First, Get your Data. You need a “Time Series.” That means data with a Date column and a Value column.
- Next, Build a Line Chart. Drag ‘Date’ to the X-axis and ‘Sales’ to the Y-axis.
- Then, check The Analytics Pane. Look for the magnifying glass icon on the right side of the visualisations panel.
- Finally, Add Forecast. Scroll down to the “Forecast” section and click “Add”.
Why this works?
Basically, Power BI is smart. In fact, it detects seasonality. For instance, if your sales always spike in Q4 and dip in Q1, the forecast power bi engine picks that up. Then, it does the heavy math for you. After that, it draws a grey line into the future with a “Confidence Interval” which is basically the margin of error.Traffic Magnet Tip.Make sure to use the term Time series forecasting Power BI when presenting this to your team. As a result, it makes you look like an expert. And you did not even write code.
Method 2. The AI Visuals (Key Influencers)
This is the secret weapon most people miss.
Specifically, Power BI has “AI Visuals.”2 These do the predictive analysis in python logic but with a drag-and-drop interface.
The Key Influencers Visual
Stop guessing why sales are down. Instead, drop the “Key Influencers” visual onto your canvas.
- Analyze Sales Decrease.
- Explain by Region, Discount, Product Category.
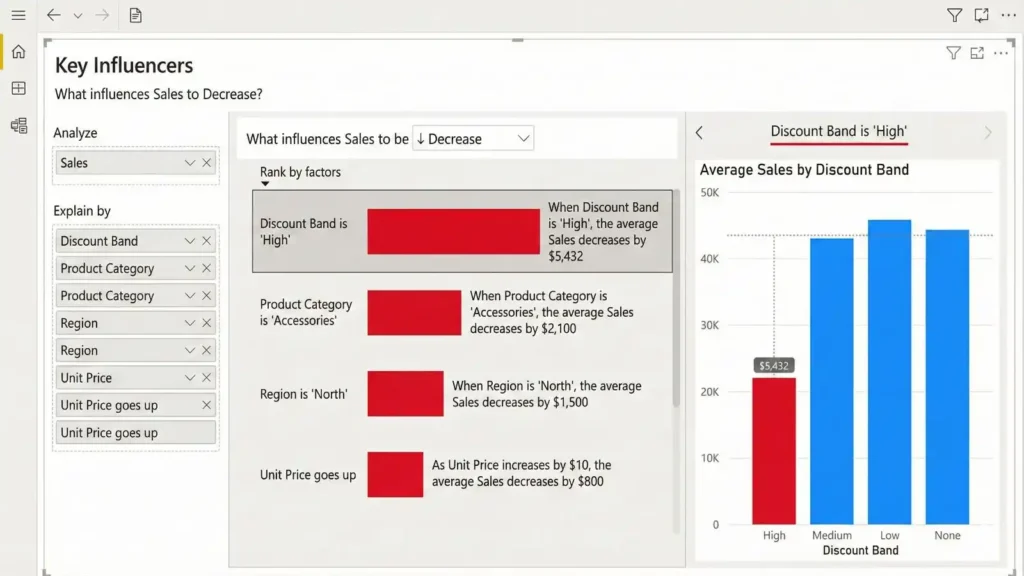
Instantly, Power BI runs a regression analysis in the background. For example, it might tell you “When the Discount is 0%, the likelihood of a Sale decreases by 2.5x.” This is pure bi predictive analytics without the headache of coding.
Method 3. Python (For the Coders)
Okay, maybe you do want to code.
Personally, I know many analysts who swear by Python. Usually, they love libraries like Scikit-Learn or Pandas. The good news is, you don’t have to give them up.
Actually, you can run predictive modelling in python scripts directly inside Power BI.3
How to do predictive analytics in Power BI with Python
- Start by installing Python. Ensure Python is installed on your local machine.
- Then, Enable Scripting. In Power BI Desktop, go to File > Options > Python scripting.
- After that, The Transformation. In the Query Editor, click “Run Python Script.”
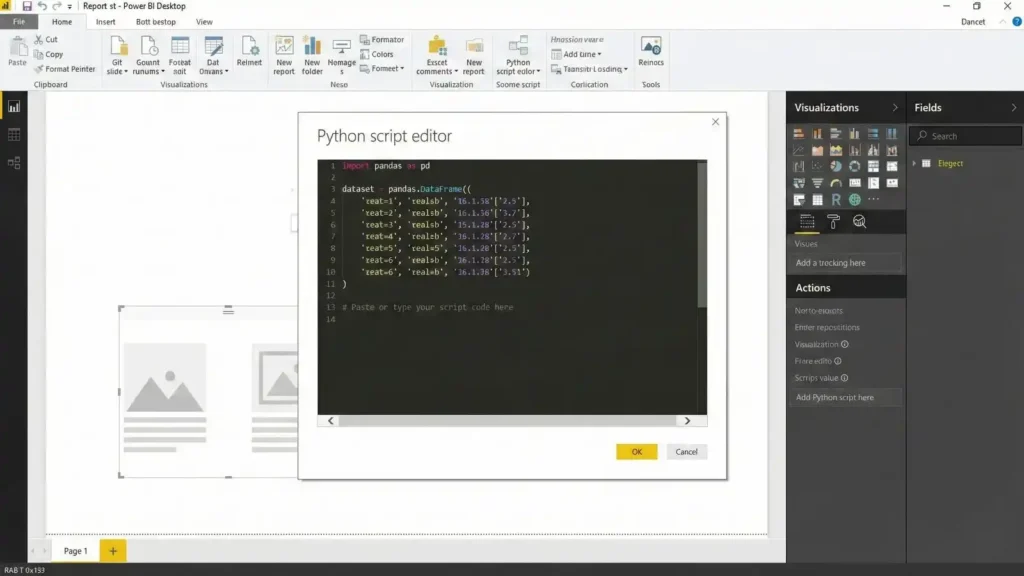
Here is a simple script you can copy to run a basic Linear Regression model on your dataset.
# Sample Python Script for Power BI
import pandas as pd
from sklearn.linear_model import LinearRegression

X = dataset[['Year']]
y = dataset['Sales']

model = LinearRegression()
model.fit(X, y)

dataset['Predicted_Sales'] = model.predict(X)
Why do this?
Admittedly, the native forecast tool is simple. But if you want to use a specific algorithm like Random Forest for python predictive analytics, then this is the way. First, Power BI processes the data. Next, it sends it to your Python script. Finally, it brings back the prediction table. Also, the same logic applies if you prefer predictive analytics with r in power bi.
Method 4. AutoML (The Premium Stuff)
If your company has the budget for a Premium license, then you get access to Power BI AutoML tutorial features.
This is bi machine learning on autopilot.
- First, you select a dataset like Customer History.
- Then, you tell Power BI what to predict. For example, the "Churn" column.
- Finally, Power BI trains multiple models. It tests them. It picks the best one.
Resultingly, it gives you a "Confusion Matrix" and an "Accuracy Report" automatically. It is powerful. But remember that it costs money.
Predictive Analytics Power Generation
Let’s look at a heavy industry example. Specifically, Predictive analytics power generation.
Recently, I worked with a global manufacturing client. They used Power BI to monitor their power backup generators. But they didn't just track fuel levels. Instead, they tracked vibration and temperature.
- The Problem. Generators would fail unexpectedly. Because of this, production stopped.
- The Fix. We built a machine learning power bi model. It flagged anomalies.
- The Result. The dashboard alerted the maintenance team. "Generator 3 vibration is abnormal. Failure predicted in 48 hours."
So, they fixed it during a lunch break. That means no downtime. That is the power of predictive analytics power bi.
Limitations of Power BI
I am not going to lie to you. Power BI is great. But it has Power BI forecasting limitations.
- The "Black Box" Issue. Unfortunately, the native forecast tool doesn't tell you how it calculated the number. So, if your boss asks for the math, you can't show it.
- Data Volume. If you throw 50 million rows at predictive analytics in power bi desktop, then it will crash your laptop. For "Big Data," you need Azure or SQL to do the heavy lifting first.
Context.Also, the tool doesn't know about the outside world. It might predict sales going up. But it does not know a competitor just opened a shop next door. Therefore, you still need human judgment.
Which Method Should You Use?
Don't waste time trying to learn everything. Instead, pick the right tool for your job.
| Method | Best For... | Skill Level | Cost |
| Native Forecasting | Simple Sales/Demand Trends | Beginner | Free |
| Key Influencers | Understanding Why something happened | Beginner | Free |
| Python/R Scripts | Custom predictive analysis in python logic | Advanced (Coding) | Free |
| AutoML | Enterprise scale machine learning | Intermediate | Paid (Premium) |
Resources to Learn More
If you want to master this, do not just watch a random video.
Go to the official Microsoft BI tutorial on the Microsoft Learn site. It is free. Plus, it covers the basics of power bi how to use.Also, start playing with predictive analytics in python. Even knowing the basics of the Pandas library gives you a massive advantage over other candidates in the job market.
Final Thoughts
Predictive analytics in power bi is the difference between leading the market and chasing it.
You have the data. Also, the tools are right there in front of you. Whether you use the simple forecast power bi feature or write complex machine learning power bi scripts, the goal is the same.
Stop guessing. Start knowing.
If you are confused about is power bi microsoft (yes, it is) or how to start, just download the Desktop version. Then, load a sample Excel file.Do the needful. Build that first model today.


Leave a Reply
You must be logged in to post a comment.